
The European Central Bank published an economic bulletin predicting global supply chain headwinds for the next 18-24 months. Supplier performance is creating supply chain imbalances; and when compared to consumer demand, is the biggest cause of supply chain disruption.
Total supply costs, whether captured or assumed, are ever-changing and influenced by variables both outside and within your organization. As a company’s performance is influenced by market conditions, economies of scale, and innovation, supply chains must be nimble enough to adapt.

The Total Cost to Serve
Supply chain outcomes are often measured in cash-to-cash cycle time and order fill-on-time metrics but ignore Total Cost to Serve—the cost of labor, processes, equipment, and resources per unit delivered to a customer. Reviewing Total Cost to Serve within your organization provides a more complete understanding of supply chain costs and leads to more predicable outcomes.
External market conditions are often cited as the reason that a company’s supply chain is underperforming and costs more than planned. The US Chamber of Commerce has cited labor shortages, rising fuel prices, ocean and domestic freight rate increases, vendor shipping delays and unpredictable consumer behavior as leading causes for supply chain disruptions. While companies usually understand how supply chain disruption came to be, often they do not know how to improve the situation or what should be done to solve supply chain woes.
The most important steps to improving disruption and calculating Total Cost to Serve are:
- Establishing key performance indicators (KPIs). KPIs compiled from various resources, such as your financials, vendor scorecards, internal tracking tools and other metrics, define past and current supply chain outcomes.
- Making sure the data driving those KPIs is trustworthy and complete.
Total Cost to Serve Metrics
Supply chain metrics are important for capturing Total Cost to Serve. Four KPIs will provide a majority of the insight into how your supply chain is performing:
- Cash Conversion Cycle (CCC) = days in receivables + days in inventory – days in payables. If you review CCC monthly history applied over the course of a few years, chances are your CCC has increased. Typically, CCC days increase because of volatile inventory fluctuations due to supplier inefficiency, variables or conditions altering past forecasting models, and inconsistent customer ordering patterns. Regardless of whether your company forecasts are based on actual sales or forecasted demand, supply chain variability affecting CCC can and will alter expected profits.
- On Time-In Full (OTIF) is a critical supply chain measurement that is both unforgiving and an accurate KPI when calculating Total Cost to Serve. All companies should strive to perform at better than 98% OTIF and, more importantly, understand all variables influencing OTIF measured results. It is also important to understand how you are measuring your OTIF. Are you measuring by the time requested by the customer, or the adjusted time you agreed upon? And are you calculating “on time” based on a day or delivery window? Does “in full” mean completed orders, line items, or cases? Understanding what is important to your customers and suppliers, and creating a consistent way to measure that metric, is key.
- Inventory to Sales Ratio is different from days in inventory but measures the productivity of your cash spent versus sales. A sales, inventory and operations planning process uses reports such as Sales and Production that synch calendars and dollars spent versus inventory sold. It guides you in predicting your on-time/in-full (OTIF) performance.
- Inventory stated in months-on-hand plus inventory velocity is a good early warning system to let planning and forecasting departments know if they should hold, increase, or decrease vendor orders. Inventory velocity helps brands determine if they have too much or too little stock to meet demand. Depending on your industry, the inventory turnover rate indicates whether have too much dead stock and or a stockout risk.
ESG and Total Cost to Serve
ESG is also important in calculating Total Cost to Serve. Many consumer goods companies and retailers concentrate on operationalizing their ESG initiatives. One ESG topic often overlooked when capturing Total Cost to Serve is carbon emissions for different transportation options.
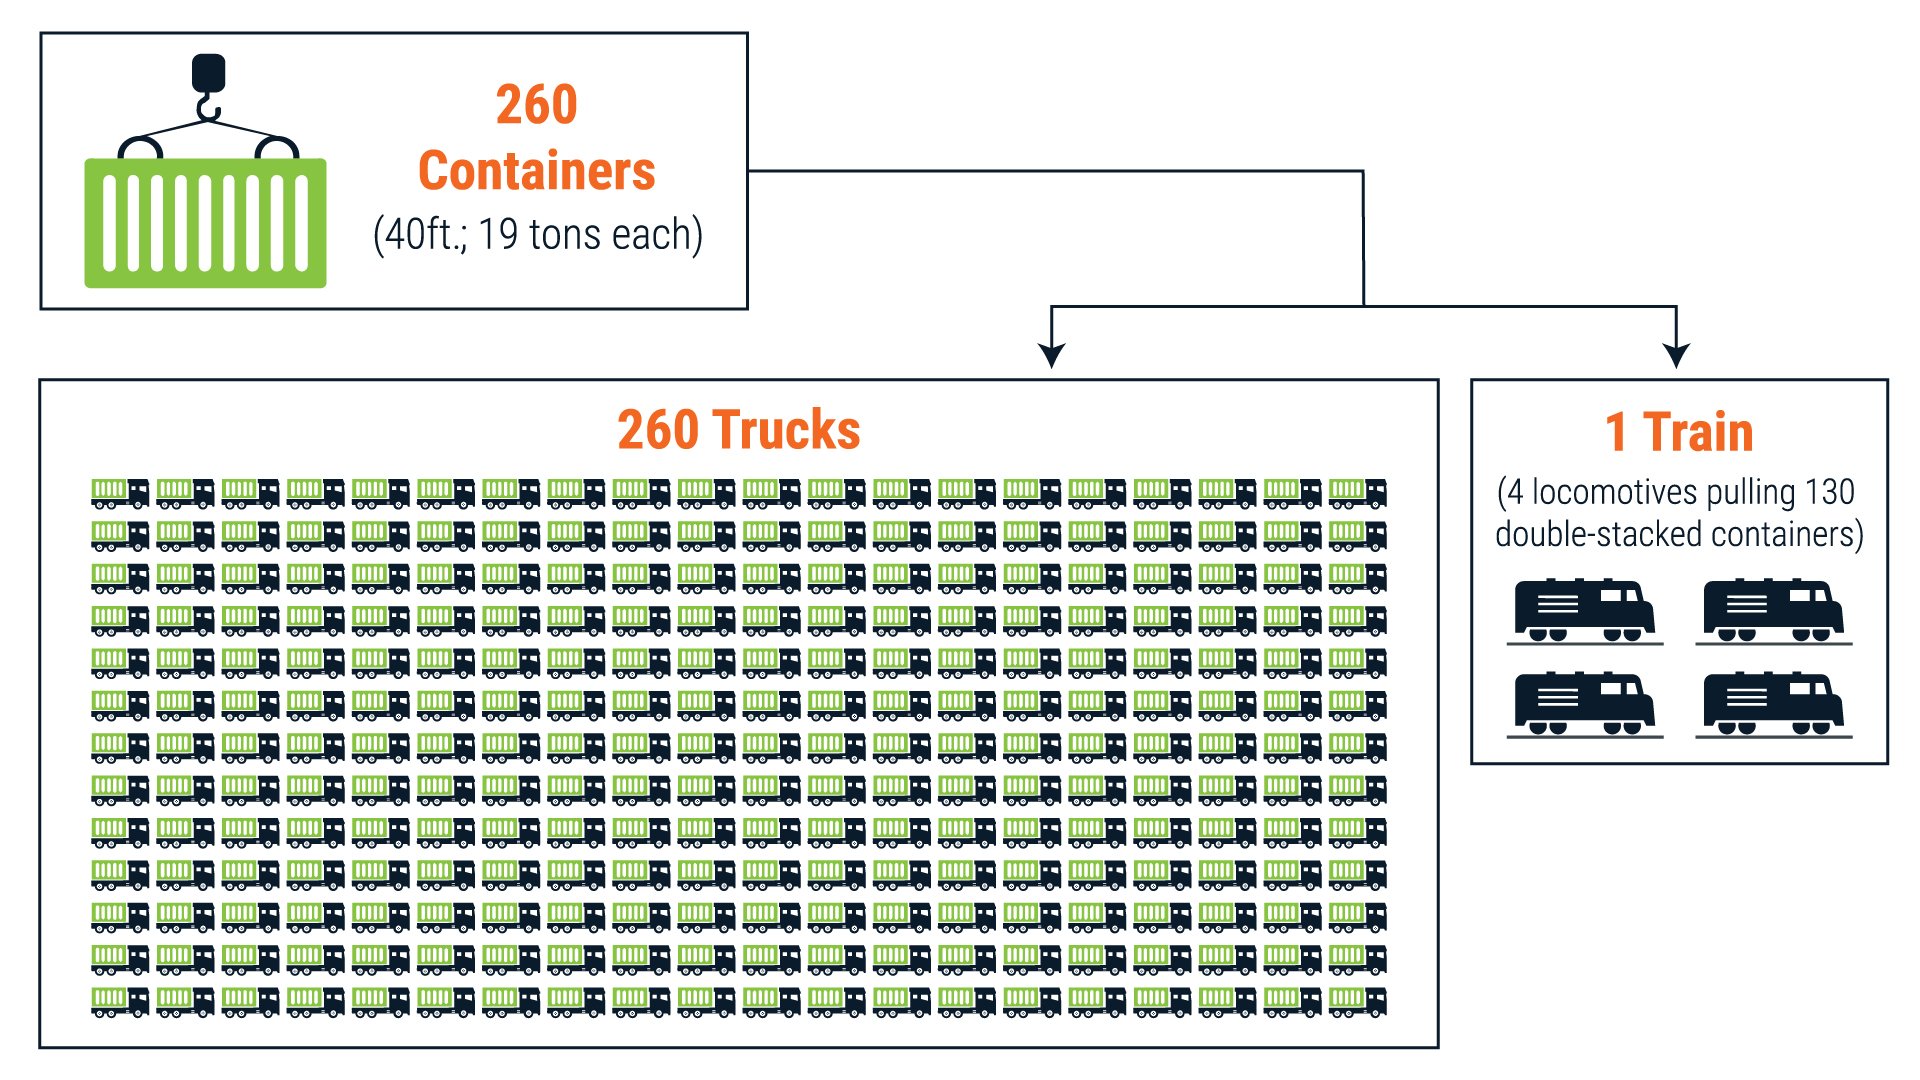
Decarbonizing heavy transportation is not only good to the environment, it can benefit the bottom line, too. California Air Research Board (CARB) is a leading government agency specializing in analyzing the environmental impact created by transporting products and people (trucks and cars). While comparing carbon emissions from common modes of transportation, “The analysis considered emissions from moving 260 cargo containers using trucks or a train from the Ports to a distance of 300 miles, as illustrated [in the figure]. Each truck transports one container. The train consists of four locomotives and transports 260 containers.” They found that a train pulling 260 containers produces 75% less in carbon emissions compared to trucks and typically costs 20% less per pound. Over time, including ESG factors such as carbon emissions in your calculations will improve your Total Cost to Serve.
Total Cost to Serve supply chain metrics are an important component to breaking down the causes and costs of supply chain disruptions. Typical supply chain costs are $0.70-$0.80 per unit, but that cost measurement no longer exists as the sole KPI when calculating Total Cost to Serve. Supply chain predictability and related performance measured in OTIF, global economic factors, and ESG factors, such as carbon emissions, are now part of today’s supply chain Total Cost to Serve calculation and should be considered when working to improve your supply chain performance, company profit, and future success in whatever marketplace you serve.
Once you understand the true Total Cost to Serve within your business, you will be armed with the insight to drive decisions around what customers you should or should not serve, what products may or may not make sense for your business anymore, and how to prioritize areas of opportunity for improvement.