Bid to Win & Price to Win Consulting Services
Every company wants to know that the opportunities they bid on are worth the time, money, and resources they cost.
The probability of win (PWin) increases as you move from sheer intuition to a structured, data-based analysis of the opportunity, your competitors, your past performance, and your company’s goals—and make the changes necessary for lasting improvement.
As the #1 supply chain and operations consulting firm in North America, we have extensive capabilities in analyzing your current bid and price to win strategy. We help you build customer intimacy, refine your pursuit-and-capture strategy, and increase market share and profitability
Submit this form to speak to an SGS Maine Pointe consultant.
Prefer to call? (781) 934 - 5569

What is your win and profit perspective?
A win perspective keeps you on track to raise your Pwin percentage; a profit perspective prevents overruns. Merely increasing the number of bids is not enough to raise your Pwin percentage, and inadequate pricing will prevent you from meeting both performance and profit targets.
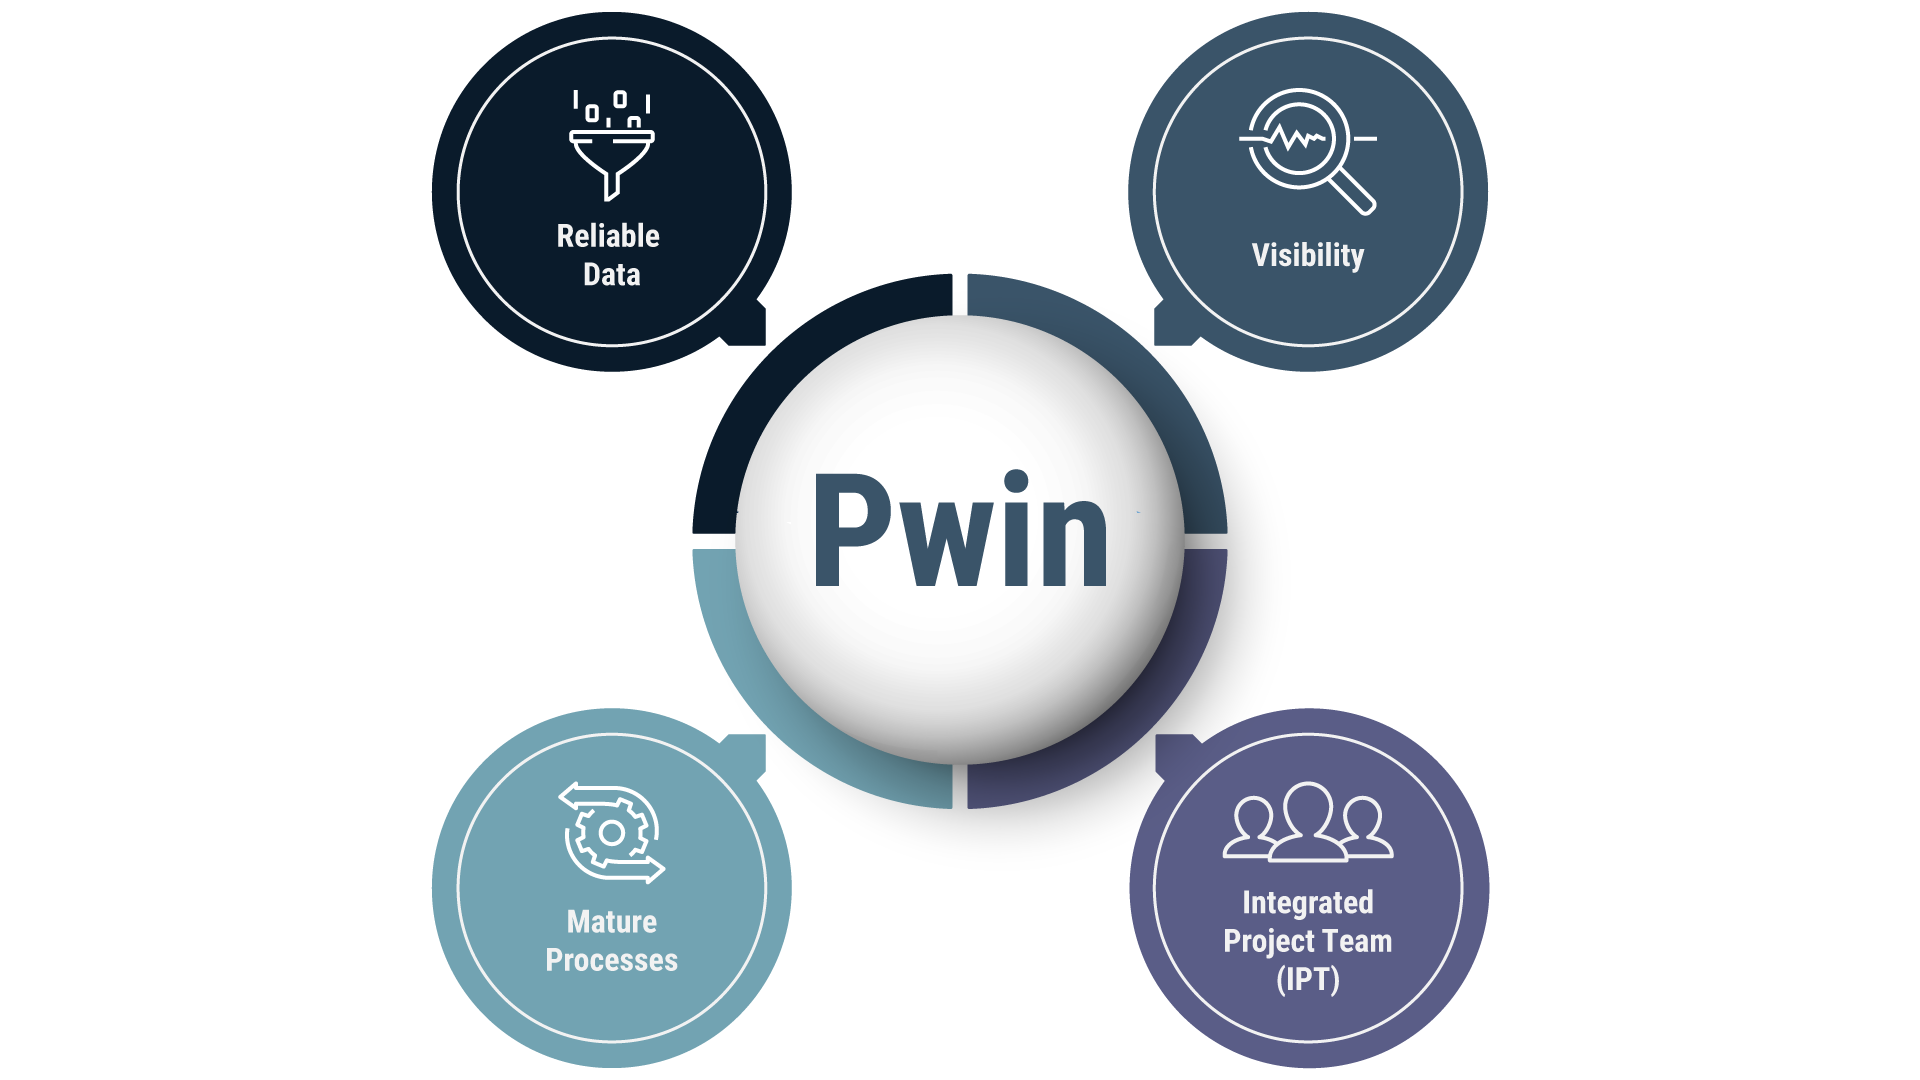
Companies in every industry are realizing they must take active steps to mature their supply chain processes; gather reliable data; increase visibility; and ensure cross-functional collaboration. Only then can they drive competitiveness and reduce costs.

How we add value
Our expertise and unique approach accelerates improvements across planning, procurement, operations, logistics, and finance.
We deploy a front-end process analysis deep dive that delivers results on a timeline tailored to your business goals.
Step #1: Rapid analysis
- Value stream mapping of the front-end and business development process to determine the current Pwin baseline.
- Identify gaps in and develop the future bid process, including roadmap and timetable
Step #2: Implementation
- Develop “voice of the customer” feedback loops and incorporate into the bid & award process.
- Create a win/loss post-mortem analysis with feedback loops to drive continuous front-end improvement.
- Provide additional processes, such as pricing, prioritization, RFP/RFI review, and a stage-gate review aligned with approval requirements to enter the next phase.
- Build cross-functional alignment (including business development, engineering, supply chain, and manufacturing) around a streamlined bill of materials process.
Continuous Improvement
We assess your bid and price to win performance and identify opportunities for immediate impact and ongoing improvement.
Our analysis enables you to:
- Understand your current process by segment.
- Uncover root drivers of performance across the plan-make-buy-move supply chain.
- Find hidden gems and potential risks.
- Position for an implementation initiatives.
Establish Data
Any improvement in Pwin and costs must begin with trustworthy data and data-based decision making. We work with your team to define requirements, methods for verifying progress and compliance with specifications, a regular reporting format, and identification of variances.
We focus on
- Data Analytics Feedback Loops
- Productivity Benchmarks and KPIs
- Total Value Optimization (TVO)™ Strategies
- Consistent Pursuit, Capture, and Execution.
Develop an Integrated Project Team (IPT)
Clarity of roles, responsibilities, and accountability are essential for improving wins and profits. By developing an integrated project team, we ensure that all functions work together to deliver on time and on budget. Moreover, all functions with a stake in the outcome are involved in decision making.
We focus on
- Establishing performance targets
- Setting bid and RFP parameters
- Driving personal accountability with an owner, responsible, consult, inform (ORCI) initiative.
- Quantifying, qualifying, and tracking revenue, growth, and market share as a result of team activities.
Sales Management Operating System
The sales management operating system (SMOS) increases conversion ratios, establishes metrics, and allocates goals. It provides a structure and criteria for making go/no go decisions and ensures a consistent value proposition.
We focus on
- Budgets/Targets
- Prospecting
- Pipeline Management
- Customer Relationship Management
- Lead Reporting
- Sales Force Management.
Product/Project Lifecycle Management (PLM)
Our stage-based PLM incorporates the data from customer and post-mortem feedback loops and from the SMOS. At each stage, from planning and qualification through to close, the decision can be made to proceed, proceed with actions, or stop.
We focus on
- Detailed Design and Prototyping
- Formal Assessment
- Verification and Validation
- Authorization to Proceed.
The Impact of Our Approach
IPT benefits
- Accelerate invoice clock
- Reduce disputes
- Maximize collection effectiveness.
SMOS benefits
- Increase Conversion Rate
- Improve Negotiation Skills
- Increase Share of Savings
- Reduce in Contract Overruns
- Promote Business Strategy Alignment.
PLM benefits
- Improve Customer Intimacy
- Refine Investment Strategy
- Execute Clearly and Consistently.
Working Capital Case Studies
| Company Description | Project Scope | Results |
|---|---|---|
|
Global Manufacturing Company |
Customer Fulfillment; Cost to Serve |
|
|
|
|
|
|
|
|
|
|
Designer & Manufacturer of Solar Panel |
|
|
|
Leading Producer of Geosynthetic Linings |
|
|
Related Resources
Maximizing EBITDA, Profits, Cash Flow, and Growth from Supply Chain Integration
Ready to speak with a consultant?

Talk to us
From rapid sprints for short-term gains to transformation for competitive advantage we are here to get you there.
Schedule a discussion
Submit this form to speak to an SGS Maine Pointe representative.
Prefer a call? (781) 934 - 5569


